KeyRegulatorFinder is a program that allows searching key regulators of lists of molecules (like metabolites, enzymes or genes) by taking advantage of knowledge databases in cell metabolism and signaling.
To use this tool, you must have a valid Transpath® license.
Up to now, this program is distributed as an all-in-one virtual machine, but we are working on a stand alone Transpath-free version. The virtual machine version works only on 64bits computers, with full virtualization support.
Install the required software
Download the required files
Install
- Install virtual box
- Install the extension pack (just click the downloaded .vbox-extpack file), after having successfully installed virtual box
- Import the virtual machine
- Click on:
File/Import virtual machine
- Choose the downloaded krv.ova file
- To easily access to your data, you may configure a shared folder between your host machine and the virtualized one by following the official tutorial.
Launch
- Select your machine in the left panel of virtual box then launch it with the green arrow. If everything works, you will see fedora starting
- Log-in with the user
infgraph, and the password inf135
- You may want to configure the machine:
- The root password is
etomp4v7
- To change the keyboard layout: press alt F2, then type
system-config-keyboard
- To change the language: press alt F2, then type
system-config-language
Troubleshooting
- Something is wrong in the USB driver
- You may have forgotten to install the Oracle VM VirtualBox Extension Pack
- You can disable USB support: right click on
your machine/configuration.../USB, then uncheck everything.
- Your processor does not support virtualization
- Check your processor name (on Windows see
start menu/control panel/system and security/system, on Linux type cat /proc/cpuinfo in a terminal). You processor must be 64bits with virtualiztion support. If your processor fill this requirements, you have to enable virtualization in your BIOS (next step), else you will not be able to install the virtual machine on this host.
- Reboot your computer, launch the BIOS and see if you can enable virtualization. The full procedure depends on your motherboard (if you do not know how to access the BIOS, or which option to check inside it to enable virtualization, you can do a web search). Most of the time, you have to press a magic key just after reboot to enter the BIOS, and then enable the virtualization option in the CPU or the security section.
- You cannot copy and paste between host and virtual machine
- First, try to enable this feature. In the top menu of the virtual machine window, enable
Devices/Shared clipboard/bidirectional. Then try to copy paste something
- If it still does not work, you need to re-install the guest additions, by following the official documentation.
Prepare your lists of molecules (genes or metabolites)
Format
A list of molecules is a text file that contains a molecule description per line. The molecule description must follow one of these formats where each field is separated by a tabulation.
HGNC_id
HGNC_id Sign
Database_id Molecule_id
Database_id Molecule_id Sign
HGNC_id the alphanumeric identifiant derived from HUGO Gene Nomenclature CommitteeSign is the observed variation of the molecule quantity between two conditions: + for an increase, - for a decrease and ? for unobserved or unrelevant variations.Database_id describes where the id comes from. Valid values are Transpath and HGNC.Molecule_id is the ID of a molecule from the database.- Comments You can write comments in your text files with
# your comment. If you do so, everything after the # will be ignored until the end of the line. You do not have any way to escape the #, so do not use it in your IDs.
- Compression The input file driver is able to handle both uncompressed and gzip compressed files, and will process them according to their extension.
.gz files are assumed to be compressed, .anything-else are assumed to be uncompressed.
Example
PPARA #The molecule PPARA in HGNC
PPARG + #The molecule PPARG in HGNC increases
Transpath MO000000327 #The molecule MO000000327 (here ATP) in Transpath
Transpath MO000000328 - #The molecule MO000000327 (here ADP) in Transpath decreases
Embeded lists of molecules
For convenience, some lists of molecules have been already prepared. All of them are in the folder in/data.
in/data/empty.txt An empty file.in/data/blacklist-remove.txt Very common molecules, that have been removed from our analysis before network construction (i.e. ATP, ADP, protein remnants, NDP, NTP, sp1, P, CoA, H2O and H+).in/data/hubs/blacklist-xxx.txt The top xxx molecules involved in most reactions (so called hubs). xxx values are 100, 500, 1000, 1500, 1800, 2000, 2200, 2500, 3000 and 4000.
Prepare your jobs
A job is a text file containing one or more job{...} sections. Each of them describes where to write the results [1], how to select relevant regulated reactions from Transpath [2,3,4,5,6], how to convert them into an influence graph, and how to analyze this graph [7,8,9]. In order to get a working job file, copy paste the following template (or download it). You only have to change the numbered commented lines.
This template search for key regulator of glycolysis enzymes described in in/data/glycolysis.txt (download). After defining where to put the result files [1], the first step is dedicated to totally ignore very common molecules described in in/data/blacklist-remove.txt (download) [2]. Then, a subgraph of Transpath is computed by taking the two first levels of neighborhood of the molecules implied in glycolysis [3,4], without using the top
xxx (in this template, xxx = 2000) hubs[5]. This graph is then converted to an influence graph, which is used to find key regulator of enzymes participating to glycolysis [8]. In this context, no more observations are available on variations of molecules [9].
| job{ |
|
| name = out/glycolysis-results |
#[1] default output files prefix |
| |
|
| filter_spaimr{ |
#Totally ignore some molecules |
| type= no_effect |
|
| blacklist = in/data/blacklist-remove.txt |
#[2] Remove the molecules from this list |
| } |
|
| |
|
| filter_spaimr{ |
#Work the neighborhood of a list of molecule |
| type = neighbor_nohub |
|
| num = 1 |
#[3] neighborhood level (WARNING see details) |
| max_hub = 0 |
|
| roles = spaim |
|
| startlist = in/data/glycolysis.txt |
#[4] take the neighborhood of molecules from this list |
| blacklist = in/data/hubs/blacklist-2000.txt |
#[5] compute the neighborhood without using this molecules |
| output = out/glycolysis-neighbor.txt |
#[6] log neighborhood results here |
| } |
|
| |
|
| compute_filter_spaimr{} |
|
| |
|
| compute_influences{ |
#build an influence graph from the selected regulated reactions |
| max_balance = 0 |
|
| compute_balance = no |
|
| compute_prod_by_unknown = yes |
|
| } |
|
| |
|
| stats_influence{} |
|
| |
|
| cneighbor{ |
#search for key regulators (you can write this block multiple times, with differents output file prefix) |
| id=out/glycolysis-key |
#[7] output file prefix for key regulators results |
| targets =in/data/glycolysis.txt |
#[8] a list of molecules describing the regulated molecules |
| observed=in/data/empty.txt |
#[9] a list of molecules (that may be empty), containing additionals informations on molecules variations |
| } |
|
| |
|
| write_full_graph{} |
|
| |
|
| } |
#end job |
| |
|
Parameters details
- [1] Except for the path defined in [6,7], all output file paths will begin by this prefix. Each job must have a unique output prefix. Be careful if a file exists at the defined location, it will be overwritten without any prior warning.
- [2] The molecules defined in this black list are removed from all regulated reactions, and are never taken into account in the analysis. From a biological point of view, the list must contain common molecules that are supposed to have no effect on the system.
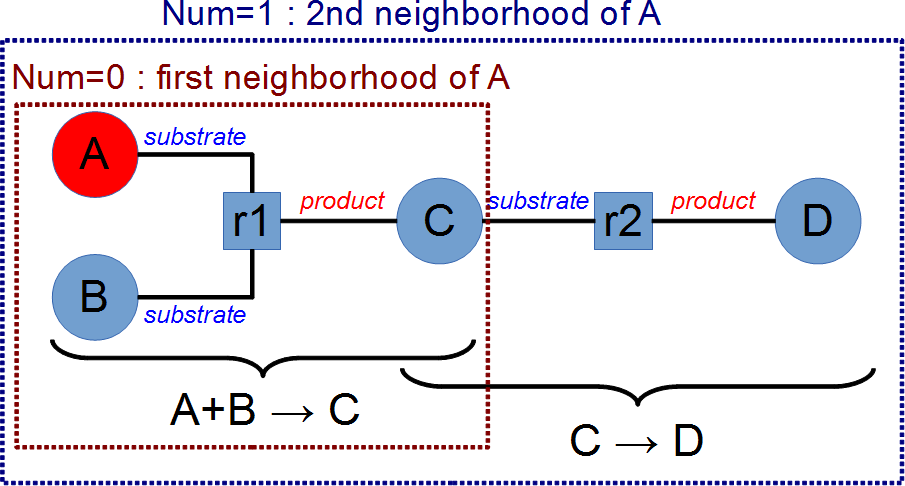
- [3,4] The neighborhood is computed by taking all the molecules at a distance of
num reactions from the molecules described in the startlist. The parameter value num=0 means all molecules from the list, all the reactions where this molecules are implied and all molecules implied in such reactions. This is illustrated on the following picture that describes two reactions (r1:A+B→C and r2:C→D), where the startlist contains only A and the blacklist is empty. With num=0, the reaction r1 and the molecules A,B and C are selected ; with num=1 the reactions r1 and r2, and the molecules A,B,C and D are selected.
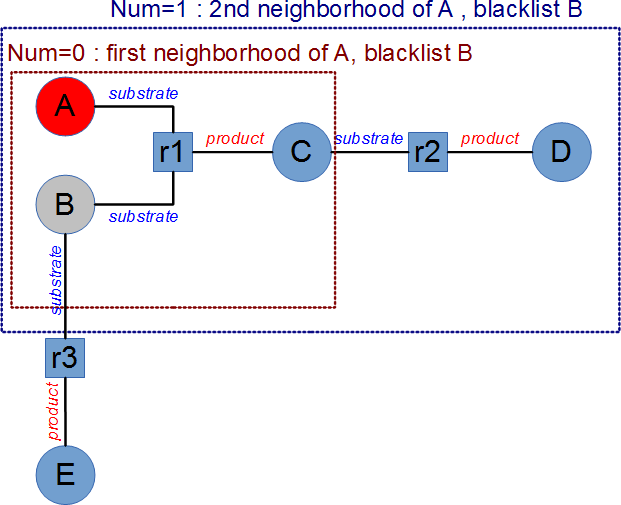
- [5] The molecules defined in the blacklist are not used during neighborhood computations, but they are added to the network if a reaction in which they are involved is selected. The following picture describes three reactions (r1:A+B→C, r2:C→D and r3 : B→E) with a startlist containing A, and a blacklist containing B. The neighborhood is computed as if B does not exists, therefore with
num=1 the reactions r1 and r2 are selected. Then all the molecules implied in these reactions are taken into account, therefore A,B,C and D will be selected.
- [6] Log the neighborhood computation results in this file. Be careful if a file exists at the defined location, it will be overwritten without any prior warning
- [7] Write the results of key regulator search in this file. Be careful if a file exists at the defined location, it will be overwritten without any prior warning
- [8] The procedure search for key regulators of the molecules described in this list
- [9] If you observe additional information on molecules variations, this information can be taken into account by the key regulator finder algorithm by adding them in this list
Run your jobs
- On the desktop open the folder
infgraph/bin. Then right click on the folder background and choose open a terminal here
- Type
./cpp-4b-Graph in/your_job_file.conf. You can add multiple job files by separating each file path by a space. For example, to launch the gylcolysis example type ./cpp-4b-Graph in/glycolysis.conf.
Read your results
Logs
- The file
out/joblog.txt collects job status of all launched jobs. In order to be sure that everything worked, you should start by reading it.
- The file
xxx.logcontain details of the job named xxx.
Mapping key regulators IDs
Misspelled IDs or missing mapping information between HGNC and Transpath may produce a bad mapping between the input lists of IDs and information in Transpath database. To check if everything worked properly, the mapping results between your IDs (provided in the lists targets and observed of the cneighbor{...} block) are summarized in a file called xxx.mapping, where xxx is the filepath defined in the id field of the cneighbor{...} block. Unmapped molecules are ignored during the analysis.
Generic statistics
The statistics are in the xxx-stats-yyy.txt files, where xxx is the job name.
xxx-stats-inf-basic.txt
nb_inf Total number of influencesnb_inf+ Number of positive influencesnb_inf- Number of negative influencesnb_inf? Number of unknown influencesnb_nodes Number of nodes
xxx-stats-inf-edgematrix.txt
This files contains a tabulation separated matrix. The number column s, line t is the number of influence which start from a node of type s, and finishes to a node of type t.
xxx-stats-inf-nodetypes.txt
The number of nodes of each type.
xxx-stats-inf-epn.txt
This file summarizes the number of edges per node.
node_id The node IDedges_in Number of edges where this node is a targetedges_out Number of edges where this node is a sourceedges_sub edges_in + edges_out
Key regulators scores types
score_coverage_all is the total number of regulated molecules. High score means ubiquitous regulators of everything.score_coverage_targets is the number of regulated molecules among the molecules described in the list defined in targets =mylist.txt. High score means generic regulators of the targets i.e., regulators that regulates many target but maybe many other things.score_hypergeometric is computed by an hypergeometric test between the number of regulated target (i.e., score_coverage_targets), and the number of regulated molecules (i.e, score_coverage_all). High value means that the molecules regulate more targets than non targets. Note : a molecule that only regulate a single target, and nothing else has an high score_hypergeometric value.score_productThis is the product between score_hypergeometric and score_coverage_targets. High value means specific regulators : i.e., regulators that regulates many targets and few other things.score_rndA random value, used for debug purpose only
Key regulators scores values
The key regulators scores are collected in a file named xxx.scores where xxx is the filepath defined in the idfield of the cneighbor{...} block. This file is a tabulation separated array composed of the following columns.
moleculeThe Transpath ID of the moleculenameThe Transpath name of the moleculescore_idThe corresponding score (ids are explained in the above section)score_value_allWhen the molecule is unobserved, the max of score_value_plus and score_value_minus. when the molecule is observed, the score corresponding to its variation.score_value_plusThe score value when the molecule increasesscore_value_minusThe score value when the molecule decreases
Graphs
The output folder contains files entitled xxx-score-score_zzz.graphml.gz, where xxx is the output prefix used in the job description with name=xxx and zzz is the score type. Such files can be opened by any graph program that is compatible with graphml format, as Cytoscape with the graphml plugin, and uncompressed with gunzip yyy.gz or 7zip. Each file contains a graph where molecules are annotated with the corresponding score. Depending on your analysis, the program can produce very large graph that can overflow the capacity of your viewing software or your RAM, so check the generic statistics before loading this graphs.